In advance of a major report on the effects of Hurricane Sandy and the city’s policies going forward, today city officials held a briefing with slides on some of the climate science that the report will contain, including new maps for areas at risk from storms, and updated projections on climate impacts like heat waves.
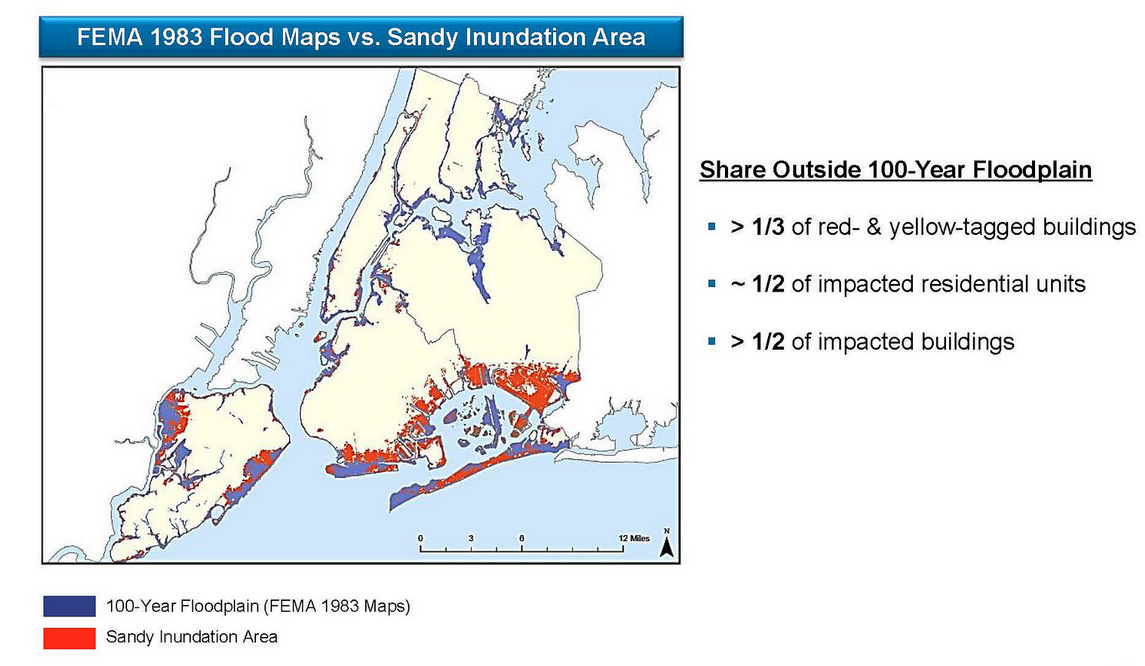
The image above, Slide 15, shows — in red — the extent that the storm surge from Sandy exceeded FEMA’s estimated boundaries for a ‘100-Year Flood.’ About half of affected residential units were outside the previous flood lines.
The full set of slides from the briefing are available on the city’s Flickr page. Also noted among the new projections:
Slide 19 shows that the number of 90° plus days could double or triple by 2050, matching the current level of Birmingham, Alabama.
Slide 20 shows that the population at risk in the updated ‘100 year floodplain’ is projected to rise to 801,000 by the 2050’s, double the number affected by Sandy.
The mayor’s office and multiple advisors — including the CUNY Institute for Sustainable Cities, home of City Atlas — have been at work on the definitive report on Hurricane Sandy, and on future planning for New York City in light of the impact of climate change. The city’s report is titled the Special Initiative for Rebuilding and Resiliency, or SIRR. A placeholder website has been up for months, but the full report will be released tomorrow, June 11.